因为我们这次需要用到streamlit、streamlit-aggrid以及plotly模块,先通过pip命令将这些模块下载下来,其中streamlit-aggrid主要是将数据表能够呈现在页面上
pip install streamlit-aggrid

pip install plotly
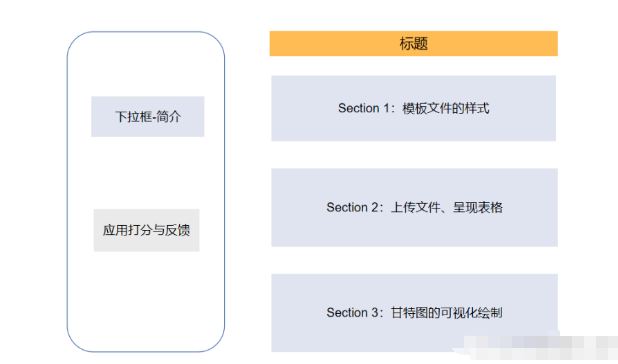
整体页面的结构是左边有一个工具栏,包含了该网页的一些简短介绍、以及一个希望使用者评分和反馈的模块
而右边则的Section1是项目规划文件的模板样式,主要是在CSV文件当中写清楚任务的细节,包括任务名称、任务描述、开始与结束时间等等内容。Section2则是允许用户上传自己的CSV文件,修改CSV文件中项目的内容以及一个可视化的呈现,而Section3则是将上述的内容导出至HTML文件当中去
下面便是该页面的代码部分
from st_aggrid import AgGrid

import streamlit as st

import pandas as pd

import numpy as np

import plotly.express as px

from  PIL import Image

import io
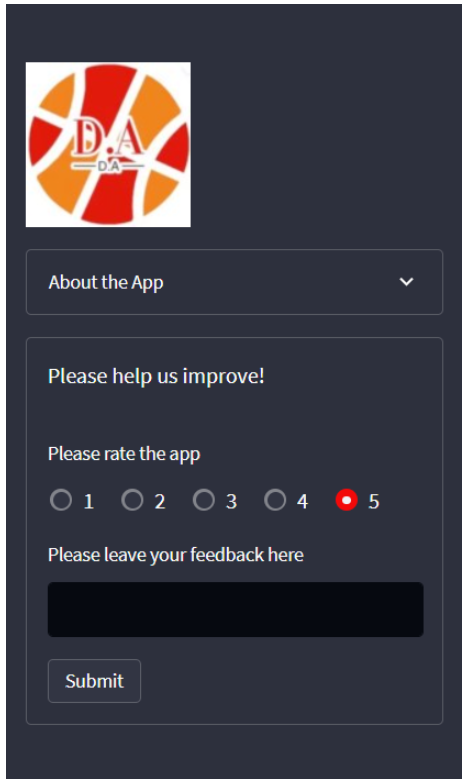
接下来我们针对左边工具栏的部分进行一个开发,主要是对该页面进行一个简单的介绍以及评分等功能
logo = Image.open(r'wechat_logo.jpg')

st.sidebar.image(logo,  width=120)


with st.sidebar.expander("关于此APP的功能"):

     st.write("""

        项目的简单介绍)

     """)


with st.sidebar.form(key='columns_in_form',clear_on_submit=True):

    st.write('反馈')

    st.write('<style>div.row-widget.stRadio > div{flex-direction:row;} </style>', unsafe_allow_html=True) # 水平方向的按钮

    rating=st.radio("打分",('1','2','3','4','5'),index=4)

    text=st.text_input(label='反馈')

    submitted = st.form_submit_button('提交')

    if submitted:

      st.write('感谢')

      st.markdown('您的评分是:')

      st.markdown(rating)

      st.markdown('您的反馈是:')

      st.markdown(text)
结果如下图所示
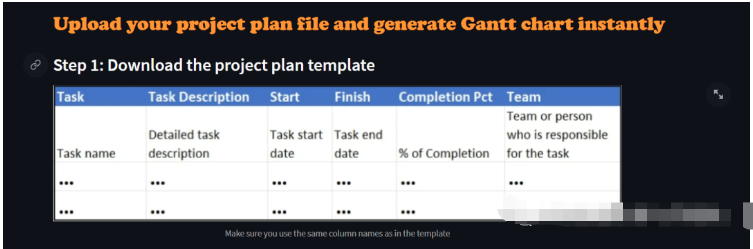
接下去便是主页面的Section 1部分的开发,主要是展示项目CSV文件的样式,包含了哪些列、列名分别是什么等等,代码如下
st.markdown(""" <style> .font {

    font-size:30px ; font-family: 'Cooper Black'; color: #FF9633;}

    </style> """, unsafe_allow_html=True)

st.markdown('<p class="font">上传您的CSV文件</p>', unsafe_allow_html=True)


st.subheader('第一步:下载模板文件')

image = Image.open(r'example.png') # 模板文件的截图

st.image(image,  caption='确保列名是一致的')


@st.cache_data

def convert_df(df):

     return df.to_csv().encode('utf-8')


df=pd.read_csv(r'template.csv', encoding='gbk')

csv = convert_df(df)

st.download_button(

     label="下载模板",

     data=csv,

     file_name='project_template.csv',

     mime='text/csv',

 )
我们提供了下载按钮可以让用户一键下载模板文件,最后呈现的样子是这样的
接下去便是上传我们自己的CSV文件,这里我们用到了streamlit_aggrid模块,该模块的好处就在于可以对数据表进行一个展示,并且可以对其中的数据进行修改,
st.subheader('Step 2: Upload your project plan file')

uploaded_file = st.file_uploader(

    "上传文件",

    type=['csv'])

if uploaded_file is not None:

    Tasks = pd.read_csv(uploaded_file, encoding='gbk')

    Tasks['Start'] = Tasks['Start'].astype('datetime64')

    Tasks['Finish'] = Tasks['Finish'].astype('datetime64')


    grid_response = AgGrid(

        Tasks,

        editable=True,

        height=300,

        width='100%',

    )


    updated = grid_response['data']

    df = pd.DataFrame(updated)
output
接下去便是对数据的可视化呈现了,这里是用Plotly模块来绘制甘特图,我们可以选择是以团队的维度来绘制或者是以项目完成的进度来绘制,代码如下
st.subheader('第三部:绘制甘特图')


Options = st.selectbox("以下面哪种维度来绘制甘特图:", ['Team', 'Completion Pct'], index=0)

if st.button('绘制甘特图'):

    fig = px.timeline(

        df,

        x_start="Start",

        x_end="Finish",

        y="Task",

        color=Options,

        hover_name="Task Description"

    )


    fig.update_yaxes(

        autorange="reversed")


    fig.update_layout(

        title='Project Plan Gantt Chart',

        bargap=0.2,

        height=600,

        xaxis_title="Date",

        yaxis_title="Project Name",

        title_x=0.5,

        xaxis=dict(

            tickfont_size=15,

            tickangle=270,

            rangeslider_visible=True,

            side="top",

            showgrid=True,

            zeroline=True,

            showline=True,

            showticklabels=True,

            tickformat="%x\n",

        )

    )


    fig.update_xaxes(tickangle=0, tickfont=dict(family='Rockwell', color='blue', size=15))

    st.plotly_chart(fig, use_container_width=True)  # 绘制甘特图至页面上

    st.subheader(

        'Bonus: 导出至HTML')

    buffer = io.StringIO()

    fig.write_html(buffer, include_plotlyjs='cdn')

    html_bytes = buffer.getvalue().encode()

    st.download_button(

        label='Export to HTML',

        data=html_bytes,

        file_name='Gantt.html',

        mime='text/html'

    )

else:

    st.write('---')